)
)
)
)
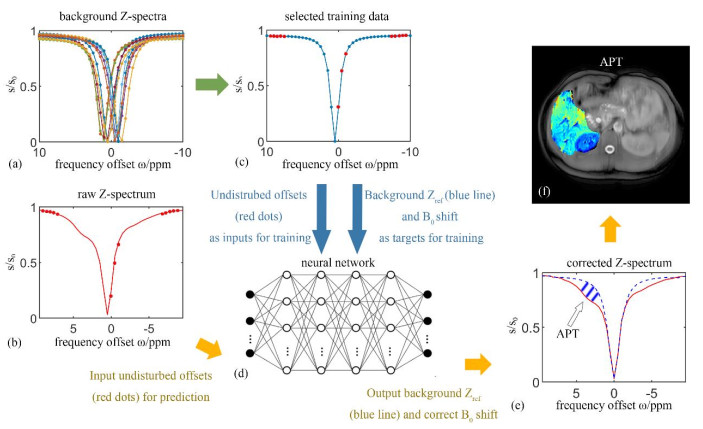
图1. 数据处理流程.(a)数值仿真生成的背景参考Z谱集;(b)采集得到的任一像素的原始Z谱,其中将红色点处的数据输入网络,以得到该像素的背景参考Z谱和水峰偏移量,用于后续的Z谱矫正;(c)任一仿真背景参考Z谱,其中红色点处的数据作为模型的训练输入,完整的Z谱(蓝线)以及水峰偏移量作为模型的训练输出;(d)使用的神经网络模型;(e)蓝紫色虚线为矫正后的背景参考Z谱,红色实线为矫正后的原始Z谱,箭头所指的阴影部分为两者相减得到的APT效应的贡献;(f)生成的APT图像
Fig.1. Schematic of data processing. (a) Simulated background Z-spectra; (b) The acquired raw Z-spectrum, in which the red solid dots are inputted into the neural network to produce background reference Z-spectrum and water peak offset for correcting Z-spectrum later; (c) A simulated background Z-spectrum, in which the data marked as red solid dots are inputs for training and the complete Z-spectrum represented by blue line as well as the water peak offset are targets for training; (d) The feedforward neural network generated and applied; (e) The water peak offset and the background Z-spectrum (marked as bluish violet dashed curve) are obtained from the network and used to correct the raw Z-spectrum. The shaded part indicated by the arrow is the difference between bluish violet dashed curve and red solid curve, which is contributed from APT effect; (f) The APT map