


引言
前列腺癌(prostate cancer,PCa)是男性最常见的癌症之一,其发病率有逐年增高趋势,该病的诊断及治疗是临床研究的重点[1].穿刺活检是临床诊断金标准,但为有创检查[2-3],目前影像学检查也逐渐应用于PCa的诊断中[4].MRI能够从水分子扩散、循环灌注及微观层面反映前列腺组织的结构及功能改变,逐渐用于PCa的定位、诊断及侵袭性评估[5].然而部分前列腺增生(benign prostatic hyperplasia,BPH)与PCa在MRI上的表现具有相似性,传统MRI难以准确鉴别[6].有研究表明,T2加权成像(T2 weighted imaging,T2WI)对PCa诊断敏感度高,但特异性低[7].扩散加权成像(diffusion- weighted imaging,DWI)纹理分析是基于影像组学的新技术,通过分析MR图像中体素的灰度分布关系,对肿瘤的特性进行量化分析,从而辅助鉴别肿瘤的良恶性[8].目前,MRI纹理分析在肺癌、肝癌等领域中展示出应用潜力,但在前列腺疾病方面仍处于探索阶段[9,10].本研究探讨T2WI和DWI影像组学在鉴别PCa和BPH中的价值,以期为临床提供依据.
1 实验部分
1.1 一般资料
回顾性分析2020年1月至2024年10月在我院进行前列腺MR检查的患者资料.纳入标准:(1)临床信息资料完整,均经病理学确诊;(2)均在本院实施MRI检查,T2WI、DWI图像清晰;(3)穿刺检查或手术治疗均在MRI检查诊断后1个月内进行.排除标准:(1)在实施MRI检查前实施放疗、化疗及手术治疗;(2)影像图像质量欠佳,序列不完整;(3)合并其他类型原发肿瘤.最终纳入180例患者.本研究为回顾性非介入性临床研究,所使用影像资料进行匿名化处理,免除患者知情同意.
1.2 检查方法
检查前排空膀胱直肠,患者仰卧接受检查.本次采用GE750W3.0T高场MR成像仪.横轴位高分辨率T2WI扫描参数:层厚3 mm,层间距1 mm,重复时间(TR)3 000 ms,回波时间(TE)135 ms,成像视野(FOV)220 mm×220 mm;横轴位DWI扫描参数:层厚3 mm,层间距1 mm,TR 5 000 ms,TE 80 ms,FOV 220 mm×220 mm,b=50、800、1 500 s/mm2,选择1 500 s/mm2的b值进行分析.
1.3 图像分割与分析
在本研究中,我们首先将T2WI和DWI的横轴位图像保存为nii格式,并使用3DSlicer软件(版本4.11.0,
其中,xi代表直方图中的第i个灰度级或取值;E代表数学期望(Expectation),表示对随机变量取平均的运算;X代表灰度值这一随机变量;p(xi)代表灰度值为xi时出现的概率(即该灰度级在直方图中所占比例).
图1
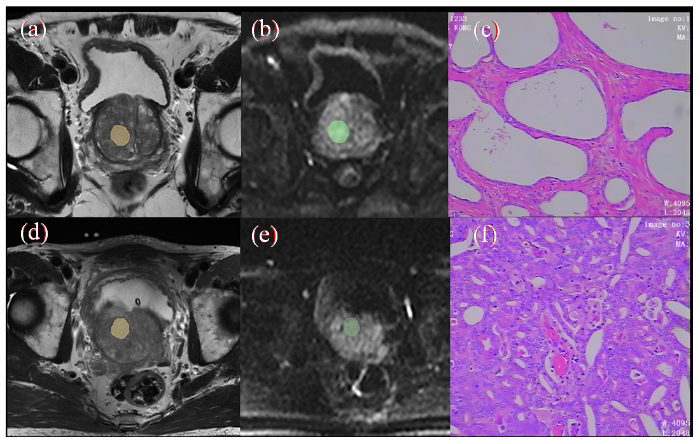
图1
病灶勾画示意图及病理组织染色图. (a)~(c)为PCa图像,(d)~(f)为BPH图像;(a)/(d)显示T2WI上勾画ROI;(b)/(e)为DWI上勾画ROI;(c)/(f)显示病理组织染色图(HE×100)
Fig. 1
Schematic diagram of lesion delineation and pathological tissue staining (a)~(c) are PCa images, (d)~(f) are BPH images; (a)/(d) display ROI delineated on T2WI; (b)/(e) draw ROI on DWI; (c)/(f) display pathological tissue staining image (HE×100)
1.4 特征筛选及模型建立
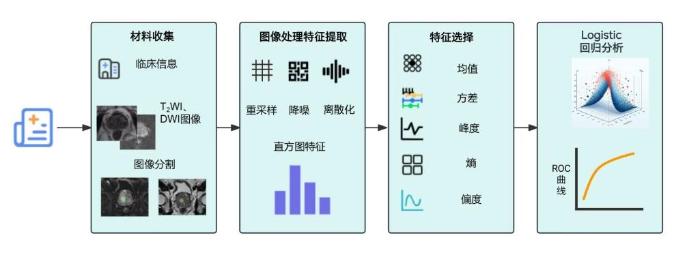
将T2WI、DWI两组数据集的灰度直方图特征(方差、熵、峰度、偏度、均值)通过独立样本t检验进行组间分析,比较PCa、BPH之间的差异.将方差T2WI、熵T2WI、峰度T2WI、偏度T2WI、方差DWI和平均值DWI作为自变量,是否PCa组作为因变量进行Logistic回归分析. 详细实验设计流程如图2.
图2
1.5 统计学处理
采用SPSS 22.0软件进行统计学分析,计量数据包括:年龄、身体质量指数、T2WI、DWI直方图参数等,数据以(x±s)表示,采用独立样本t检验比较组别差异;将方差T2WI、峰度T2WI和平均值DWI构建PCa预测模型,并通过受试者工作特征(ROC)曲线评价该模型的预测能力.P<0.05表示差异有统计学意义.标准错误a(Standard Error,SE)指ROC曲线下面积(AUC)估计值的标准误,用于衡量AUC估计的不确定性和稳定性;标准错误越小,说明AUC估计越精确、可靠.渐近显著性b(Asymptotic Significance,P值)为基于大样本理论计算的AUC显著性检验的P值,用于判断AUC是否显著高于0.5(即是否具有区分能力).
2 结果与讨论
2.1 临床资料
本次共入组180例患者,其中经病理证实PCa组90例,BPH组90例,两者年龄等一般资料比较无统计学差异(P>0.05),见表1.
表1 PCa和BPH患者一般资料比较
Table 1
| 指标 | PCa(n=90) | BPH(n=90) | t | P |
|---|---|---|---|---|
| 年龄/岁 | 75.78±8.01 | 74.67±5.39 | 1.092 | 0.276 |
| 身体质量指数/(kg/m2) | 22.14±2.03 | 22.05±1.98 | 0.301 | 0.764 |
注:t为独立样本t检验统计量,用于比较Pca与BPH两组连续变量的均值差异.
2.2 基于T2WI图像的PCa和BPH直方图参数比较
PCa基于T2WI图像的纹理参数(方差T2WI、熵T2WI、峰度T2WI、偏度T2WI和平均值T2WI)明显低于BPH(P<0.05).相关参数比较具体见表2.
表2 PCa和BPH基于T2WI图像的直方图参数比较
Table 2
| 指标 | PCa(n=90) | BPH(n=90) | t | P |
|---|---|---|---|---|
| 方差T2WI | 2403.62±688.66 | 4333.2±612.01 | -19.869 | <0.001 |
| 熵T2WI | 4.94±0.63 | 5.15±0.57 | -2.301 | 0.023 |
| 峰度T2WI | 0.58±0.06 | 0.63±0.16 | -3.026 | 0.003 |
| 偏度T2WI | 0.31±0.15 | 0.54±0.20 | -8.972 | <0.001 |
| 平均值T2WI | 670.52±120.42 | 710.25±104.03 | -2.368 | 0.019 |
注:t为独立样本t检验统计量,用于比较Pca与BPH两组在各直方图特征参数上的均值差异.
2.3 基于DWI图像的PCa和BPH直方图参数比较
PCa基于DWI图像的直方图参数:峰度DWI明显低于BPH,平均值DWI明显高于BPH(P<0.05);PCa和BPH熵DWI、方差DWI和偏度DWI比较差异无统计学意义(P>0.05).相关参数比较具体见表3.
表3 PCa和BPH基于DWI图像的直方图参数比较
Table 3
| 指标 | PCa(n=90) | BPH(n=90) | t | P |
|---|---|---|---|---|
| 方差DWI | 1836.78±725.29 | 1681.54±768.11 | 1.394 | 0.165 |
| 熵DWI | 6.18±0.77 | 6.33±0.82 | -1.294 | 0.197 |
| 峰度DWI | 0.09±0.04 | 0.11±0.05 | -2.570 | 0.011 |
| 偏度DWI | 0.10±0.05 | 0.09±0.04 | 1.392 | 0.166 |
| 平均值DWI | 464.5±108.03 | 292.69±81.55 | 12.042 | <0.001 |
2.4 PCa预测因素挖掘及预测模型筛选
采用Modeler软件进行数据挖掘和建模,选定研究数据进行数据类型筛选,并通过特征选择筛选重要指标,并通过自动分类器构建数据流,筛选模型共筛选出预测PCa的3个模型分别为:Logistic回归模型、贝叶斯网络模型、决策树C5.1模型,模型预测PCa的准确率分别为100.000%、98.889%、98.333%.其中Logistic回归模型预测的准确率最高.贝叶斯网络模型、决策树C5.1模型预测结果的模型结构图如图3所示.
图3
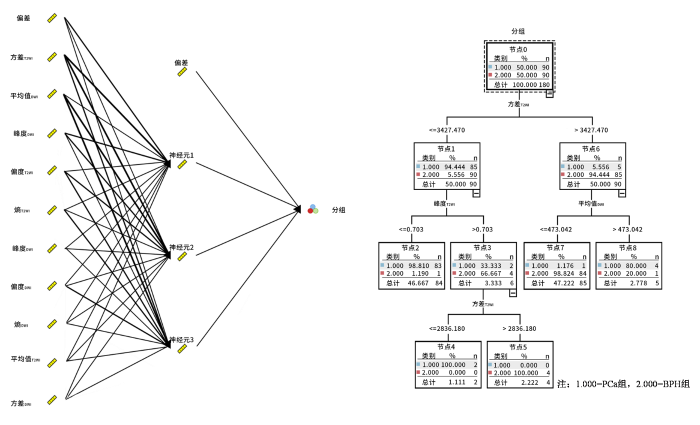
图3
贝叶斯网络模型、决策树C5.1模型预测结果的模型结构图
Fig. 3
Model structure diagram of Bayesian network model and decision tree C5.1 model prediction results
2.5 PCa预测模型构建
将方差T2WI、熵T2WI、峰度T2WI、偏度T2WI、平均值T2WI、峰度DWI和平均值DWI作为自变量,是否PCa组作为因变量进行Logistic回归分析.独立影响因素的筛选主要依据各变量回归系数的P值(P<0.05表示具有独立预测作用).同时参考了β、标准误(SE)、Wald值以及OR及其95%CI,以综合判断模型的稳定性和效应量.结果显示,方差T2WI(P=0.032)和平均值DWI(P=0.025)在多因素模型中仍表现出统计学意义,提示其为PCa的独立影响因素;其他变量P>0.05,未进入最终模型.见表4.
表4 PCa预测模型
Table 4
| 因素 | β | SE | Walds | P | OR | 95%CI | |
|---|---|---|---|---|---|---|---|
| 下限 | 上限 | ||||||
| 方差T2WI | 14.186 | 6.617 | 4.597 | 0.032 | 1448658.610 | 3.380 | 6.209E+11 |
| 熵T2WI | -2.206 | 1.372 | 2.584 | 0.108 | 0.110 | 0.007 | 1.622 |
| 峰度T2WI | 3.403 | 2.125 | 2.566 | 0.109 | 30.057 | 0.467 | 1933.646 |
| 偏度T2WI | 3.282 | 1.879 | 3.052 | 0.081 | 26.638 | 0.670 | 1058.906 |
| 平均值T2WI | 1.975 | 1.607 | 1.510 | 0.219 | 7.206 | 0.309 | 168.150 |
| 峰度DWI | 3.821 | 2.468 | 2.396 | 0.122 | 45.641 | 0.362 | 5761.451 |
| 平均值DWI | -5.986 | 2.678 | 4.995 | 0.025 | 0.003 | 0.000 | 0.479 |
| 常量 | -0.910 | 1.240 | 0.539 | 0.463 | 0.402 | ||
注:β代表回归系数;SE代表标准误差;Walds代表Wald检验的统计量,检验变量在回归模型中是否显著;P代表显著性水平;OR代表优势比;95%CI代表置信区间;常量为Logistic回归方程的截距项,表示在所有自变量取0时事件(如Pca)的基础对数发生比.
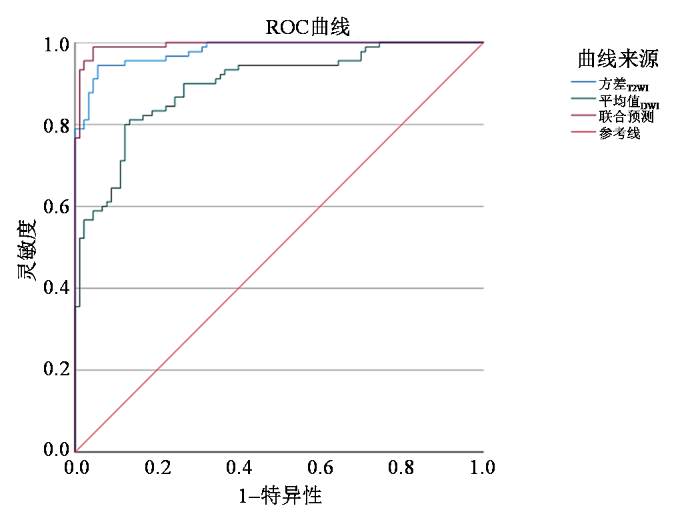
2.6 PCa预测模型预测价值
表5 PCa预测模型预测价值
Table 5
| 检验结果变量 | AUC | 标准错误a | 渐近显著性b | 95%CI | |
|---|---|---|---|---|---|
| 下限 | 上限 | ||||
| 方差T2WI | 0.980 | 0.008 | 0.000 | 0.965 | 0.995 |
| 平均值DWI | 0.896 | 0.023 | 0.000 | 0.851 | 0.941 |
| 联合预测 | 0.994 | 0.004 | 0.000 | 0.986 | 1.000 |
注:标准错误a为AUC估计值的标准误;渐近显著性b为基于大样本理论计算的AUC显著性检验P值,用于判断AUC是否显著大于0.5.
图4
2.7 讨论
PCa和BPH是男性高发的生殖系统疾病,如何对其进行准确鉴别是临床研究的重点,也是采取针对性治疗的前提.穿刺活检的有创性限制了其广泛使用.因无创的优势,MRI技术已经广泛用于PCa的诊断及预后评估中[11]. T2WI序列依据各类组织间T2值的差异来对病变组织的病理特征进行鉴别,但检查结果易受医生主观判断的影响. DWI得到的图像在非癌组织与癌组织之间差异较大,诊断恶性肿瘤的灵敏度较高[12]. 影像组学可对获取的数据进行特征化计算,将影像图像转化为空间数据,在此情况下,能够分析出肉眼难以辨别的病理改变,做到对肿瘤异质性的定量分析.影像组学纹理分析在很多肿瘤的诊断及恶性评估中发挥重要作用[13]. 在某些特殊情况下,BPH与PCa信号强度存在相似的情况,且检查结果也易受到检查者的影响,本研究同时使用T2WI和DWI影像组学纹理鉴别PCa和BPH,以期为临床提供依据.
本研究结果显示,基于T2WI图像的直方图参数分析,PCa的方差T2WI、熵T2WI、峰度T2WI、偏度T2WI和平均值T2WI明显低于BPH.影像组学纹理分析能够对MRI图像进行定量分析,对肿瘤内部微观特征及病理特征进行量化,进而实现对肿瘤异质性差异的分析,T2WI影像学纹理分析有利于为前列腺疾病的鉴别及诊断提供依据.平均值代表病灶内像素的平均灰度,研究显示[14],PCa病灶内部的腺体多被肿瘤细胞取代,肿瘤细胞大量增殖后,细胞间隙变小.腺样结构也逐渐成为实性结构,检测到的均值显著变小.良性BPH的实质成分不均匀分布,均值较大.偏度越大,说明灰度直方图越不对称,具体则表示病灶形态分布倾斜度较大[15].目前关于偏度T2WI用于BPH与PCa鉴别的研究较少[16].结合本研究结果,偏度T2WI在两种疾病中的差异具有统计学意义,可将偏度T2WI作为鉴别前列腺良恶性疾病的一个重要依据.以往有研究显示,BPH的熵值显著较PCa高[17].熵值越大,提示所获取图像越复杂,间接反映出了肿瘤异质性较大[18],与本研究结果相符.
本研究结果表明,PCa组峰度DWI明显低于BPH,平均值DWI明显高于BPH.分析其原因可能是,PCa组织通常呈现细胞密度增高、腺体结构破坏及坏死区域,导致DWI信号分布更分散(高低信号混杂),表现为峰度降低(分布平坦).BPH以均质的腺体增生为主,信号分布集中,峰度较高(分布尖峭).峰度对分布尾部的极端值敏感,PCa可能因微坏死或微出血区域产生异常信号,拉宽分布范围,进一步降低峰度值.对于DWI值,PCa细胞排列密集,细胞外间隙缩小,水分子扩散受限,DWI信号强度显著升高;而BPH组织疏松,扩散受限程度较低,平均信号强度相对较低[19].反映信号复杂度的熵值未显差异,可能提示PCa与BPH在DWI上的纹理复杂度相似,或当前分辨率未能捕获微观异质性差异.方差表征信号离散度,两者无差异可能因PCa的高信号区域与BPH的低信号区域离散程度相互抵消.偏度未显示明显差异可能是因PCa内部同时存在极高信号(肿瘤核心)和中等信号(周围浸润区域),导致分布对称性与BPH接近.
本研究将方差T2WI和平均值DWI构建PCa预测模型,发现该模型预测的AUC值较高.目前影像组学在PCa的诊断方面已有了初步的研究,以往有研究建立基于T2WI和DWI的影像组学模型可以准确鉴别高危和低危PCa,且T2WI的诊断效能最高[20].DWI弥补了T2WI诊断中灵敏度的局限性;T2WI弥补了DWI的空间分辨率差与不稳定性的局限;两者相互补充,可提高诊断效能.本研究提示T2WI和DWI影像组学纹理分析可为临床鉴别诊断PCa及BPH提供有价值的参考.
本研究仍存在一些局限性:(1)样本量相对较小,无法完全代表整个患者群体;(2)研究设计为回顾性,可能存在选择偏差,未来需要大规模的多中心前瞻性研究来验证和改进模型的预测能力;(3)本研究仅考虑了一阶纹理特征,未探索高阶纹理特征或深度学习方法;(4)图像分析依赖手动勾画ROI,可能会存在主观偏差,未来引入自动化或半自动化的图像分割方法可提高分析的可重复性和准确性.
3 结论
本研究通过T2WI和DWI影像组学纹理分析,为PCa和BPH的鉴别诊断提供了有价值的参考.将方差T2WI、平均值DWI联合构建PCa预测模型,具有较高的预测价值.证明基于T2WI与DWI的纹理特征构建预测模型对鉴别PCa有较好应用价值.
致谢
感谢南京鼓楼医院医学影像科麦筱莉教授对本研究设计的指导.感谢皖南医学院附属宣城医院消化内科周政博士对本研究提出的宝贵意见.
利益冲突
无
参考文献
Prevalence and risk factors of incidental prostate cancer in certain surgeries for benign prostatic hyperplasia: A systematic review and meta-analysis
[J].DOI:10.1590/s1677-5538.ibju.2021.0653 URL [本文引用: 1]
Prostate infiltration by Treg and Th17 cells as an immune response to propionibacterium acnes infection in the course of benign prostatic hyperplasia and prostate cancer
[J].
DOI:10.3390/ijms23168849
URL
[本文引用: 1]

Benign prostatic hyperplasia (BPH) and prostate cancer (PCa) belong to the most frequent diseases in ageing men. It has been proposed that prostate chronic inflammation is a risk factor for the development of both BPH and PCa. However, potential stimuli that cause or maintain inflammation in the prostate gland are still poorly characterized. Bacterial infections seems to be one of the potential sources of prostatitis. Recent studies show that Propionibacterium acnes (P. acnes) is the most prevalent microorganism in the prostate gland and may be a predisposing factor for inflammation of prostatic tissue. It indicates that P. acnes may contribute to cancer development by enhancing proinflammatory responses, as well as by modifying the prostate extracellular environment. In this review, we discuss the potential role of P. acnes in the development of BPH and PCa and highlight the importance of regulatory T CD4(+)FoxP3(+) (Treg) and Th17 cells in response to P. acnes infection in the context of both prostate diseases.
Mechanistic targets for BPH and prostate cancer-a review
[J].
DOI:10.1515/reveh-2020-0051
URL
[本文引用: 1]
All men, almost, suffer from prostatic disorders in average life expectancy. In the year of 1950s, the first autopsy of prostate gland discovered the link between Benign prostatic hyperplasia (BPH) and Prostate Cancer (PCa). After that, many histology, biochemistry, epidemiology studies explained the association and associated risk factor for the same. From the various scientific evidence, it is proved that both diseases share some common transcription factors and signalling pathways. Still, BPH cannot be considered as the first step of PCa progression. To define, the relationship between both of the diseases, a well-defined large epidemiological study is needed. Along with androgen signalling, imbalanced apoptosis, oxidative stress, and microbial infection also crucial factors that significantly affect the pathogenesis of BPH. Various signalling pathways are involved in the progression of BPH. Androgen signalling is the driving force for the progress of PCa. In PCa androgen signalling is upregulated as compared to a healthy prostate. Some dominant Androgen-regulated genes and their functions have been discussed in this work.
An updated systematic review on focal therapy in localized prostate cancer: what has changed over the past 5 years?
[J].DOI:10.1016/j.eururo.2021.08.005 URL [本文引用: 1]
Differential microbial signature associated with benign prostatic hyperplasia and prostate cancer
[J].
Differentiation of prostate cancer and stromal hyperplasia in the transition zone with monoexponential, stretched-exponential diffusion-weighted imaging and diffusion kurtosis imaging in a reduced number of b values: correlation with whole-mount pathology
[J].
DOI:10.1097/RCT.0000000000001314
URL
[本文引用: 1]
The aims of the study were to explore the feasibility of generating a monoexponential model (MEM), stretched-exponential model (SEM) based diffusion-weighted imaging (DWI), and diffusion kurtosis imaging (DKI) by applying the same set of reduced b values and to compare their effectiveness in distinguishing prostate cancer from stromal hyperplasia (SH) in the transition zone (TZ) area.
Study on diagnostic value of quantitative parameters of intravoxel incoherent motion diffusion-weighted imaging (IVIM-DWI) in prostate cancer
[J].To investigate the diagnostic value of quantitative parameters of intravoxel incoherent motion diffusion-weighted imaging (IVIM-DWI) in prostate cancer.From January 2019 to June 2020, 96 patients with prostatic tumor admitted in the department of urological surgery of our hospital were selected as subjects. Magnetic resonance imaging data of 48 cases of benign prostatic hyperplasia and 48 cases of prostate cancer were retrospectively analyzed. The patients included in this study received conventional MRI and IVIM-DWI examinations. Quantitative parameters of IVIM-DWI including D value, D* value, apparent diffusion coefficient (ADC) value and f value in lesions of prostatic tumor were calculated through the double exponential model fitting algorithm. D value, D* value, ADC value and f value were compared between benign prostatic hyperplasia (BPH) group and prostate cancer group. Quantitative parameters of IVIM-DWI were also compared among patients from different Gleason scores groups. The correlation of quantitative parameters of IVIM-DWI with Gleason scores and PSA concentration was analyzed. Diagnostic efficiency of quantitative parameters of IVIM-DWI for prostate cancer was evaluated by ROC curve.Compared with those in BPH group, D value, ADC value and f value in prostate cancer group were significantly lower, but D* value was obviously higher. With the Gleason score increased, D value, ADC value and f value gradually decreased, while D* value gradually increased. The diagnostic efficiency of parameters ADC and D was higher among other parameters. D value, ADC value and f value of prostate cancer were negatively correlated with Gleason score and PSA concentration, respectively (all P<0.05), while D* value was positively correlated with Gleason score and PSA concentration.Quantitative parameters of IVIM-DWI could be used for the diagnosis and evaluation of prostate cancer, and quantitative parameters of IVIM-DWI were associated with Gleason score and PSA concentration.AJTR Copyright © 2021.
Multiparametric magnetic resonance imaging in evaluation of clinically significant prostate cancer
[J].
Diagnosis of lung adenocarcinoma with brain metastases based on MRI texture features and predictive value of EGFR gene mutation in lung adenocarcinoma with brain metastases
[J].<b>Objective</b> To explore the diagnosis of lung adenocarcinoma with brain metastases based on MRI texture features and predictive value of EGFR gene mutation in lung adenocarcinoma with brain metastases. <b>Methods</b> A total of 154 patients with lung adenocarcinoma admitted were selected,and patients were divided into BMS group (n=71) and non-BMS group (n=83) according to whether they had BMS.MRI texture characteristics in the two groups were compared to evaluate the diagnostic value of energy,entropy,moment of inertia,correlation and deficit moment for lung adenocarcinoma brain metastases.EGFR gene detection was performed for patients in BMS group,and patients were divided into EGFR mutation group (n=33) and EGFR wild group (n=38).Univariate and multivariate Logistic regression analysis were performed to determine the influencing factors of MRI texture features on EGFR gene mutations in patients with lung adenocarcinoma with brain metastasis. <b>Results</b> The entropy and correlation in BMS group were significantly higher than those in the non-BMS group,and the energy,moment of inertia and deficit moment in BMS group were significantly lower than those in the non-BMS group.According to the ROC curve,the critical value of energy,sensitivity,specificity and AUC were 0.00121,69.01%,71.08% and 0.801(95%CI:0.750-0.852).The entropy critical value was 10.42,the sensitivity was 73.24%,the specificity was 69.88%,and the AUC was 0.760(95%CI:0.707-0.812).The critical value of moment of inertia was 7139.86,the sensitivity was 64.79%,the specificity was 60.24%,and the AUC was 0.708(95%CI:0.645-0.772).The critical correlation value was 0.000026,the sensitivity was 59.15%,the specificity was 60.24%,and the AUC was 0.631(95%CI:0.564-0.698).The critical value of the negative moment was 0.0301,the sensitivity was 74.65%,the specificity was 78.31%,and the AUC was 0.816(95%CI:0.768-0.864).At the optimal critical value of regression analysis,the corresponding sensitivity,specificity and AUC were 80.28%,80.72% and 0.869(95%CI:0.831-0.907).The sensitivity and specificity of regression analysis were significantly higher than that of MRI texture feature alone.Logistic analysis showed that energy,entropy,moment of inertia,correlation and deficit moment was the influencing factor of EGFR gene mutation in lung adenocarcinoma brain metastases (P<0.05). <b>Conclusion</b> Energy,entropy,moment of inertia,correlation and deficit moment were abnormally expressed in lung adenocarcinoma with brain metastases,single and regression analysis could be applied to improve the diagnostic efficiency of brain metastases.MRI based texture feature analysis can be used to predict EGFR gene mutations in lung adenocarcinoma with brain metastases.
基于MRI纹理特征的肺腺癌脑转移瘤诊断及对肺腺癌脑转移EGFR基因突变的预测
[J].目的 探讨基于MRI纹理特征的肺腺癌脑转移瘤诊断及对肺腺癌脑转移EGFR基因突变的预测价值。方法 选取154例肺腺癌患者,根据是否脑转移将患者分成脑转移组(n=71)和非脑转移组(n=83)。比较两组患者MRI纹理特征指标,评估能量、熵、惯性矩、相关和逆差矩对肺腺癌脑转移的诊断价值。针对脑转移组患者行EGFR基因检测,将患者分成EGFR突变组(n=33)和EGFR野生组(n=38),单因素和多因素Logistic回归分析确定MRI纹理特征对肺腺癌脑转移患者EGFR基因突变的影响因素。结果 脑转移组患者熵和相关等明显高于非脑转移组,脑转移组患者能量、惯性矩和逆差矩明显低于非脑转移组。根据ROC曲线可得,能量的临界值为0.00121,敏感度为69.01%,特异度为71.08%,AUC为0.801(95%CI:0.750~0.852);熵的临界值为10.42,敏感度为73.24%,特异度为69.88%,AUC为0.760(95%CI:0.707~0.812);惯性矩的临界值为7139.86,敏感度为64.79%,特异度为60.24%,曲线下面积(AUC)为0.708(95%CI:0.645~0.772);相关的临界值为0.000026,敏感度为59.15%,特异度为60.24%,AUC为0.631(95%CI:0.564~0.698);逆差矩的临界值为0.0301,敏感度为74.65%,特异度为78.31%,AUC为0.816(95%CI:0.768~0.864)。回归分析在最佳临界值是对应的敏感度为80.28%,特异性为80.72%,AUC为0.869(95%CI:0.831~0.907),回归分析的敏感度和特异性明显高于MRI纹理特征的单独诊断。Logistic分析显示,能量、熵、惯性矩、相关和逆差矩是肺腺癌脑转移EGFR基因突变的影响因素(P<0.05)。结论 能量、熵、惯性矩、相关及逆差矩等MRI纹理特征在肺腺癌脑转移瘤中异常表达,单独及回归分析联合诊断可应用于提高肺癌脑转移的诊断效能;且基于MRI纹理特征分析可以用于预测肺腺癌脑转移EGFR基因突变。
Relationship between pre-operative MRI texture features and prognosis of patients with hepatocellular carcinoma
[J].
MRI术前肝细胞肝癌患者图像纹理参数表现与患者预后的关系
[J].
Prostate cancer diagnosis based on cascaded convolutional neural networks
[J].
基于级联卷积神经网络的前列腺磁共振图像分类
[J].
DOI:10.11938/cjmr20192717
[本文引用: 1]
针对深度学习训练成本高,以及基于磁共振图像的前列腺癌临床诊断需要大量医学常识且极为耗时的问题,本文提出了一种基于级联卷积神经网络(Convolutional Neural Network,CNN)和磁共振图像的前列腺癌(Prostate Cancer,PCa)自动分类诊断方法,该网络以Faster-RCNN作为前网络,对前列腺区域进行提取分割,用于排除前列腺附近组织器官的干扰;以基于ResNet改进的网络结构CNN40bottleneck作为后网络,用于对前列腺区域病变进行分类.后网络由瓶颈结构串联组成,其中使用批量标准化(Batch Normalization,BN)、全局平均池化(Global Average Pooling,GAP)进行优化.实验结果证明,本文方法对前列腺癌诊断结果较好,而且缩减了训练时间和参数量,有效降低了训练成本.
Preliminary application of MR-T2WI texture analysis for detection of prostate cancer basing on FireVoxel software
[J].
基于FireVoxel软件MR-T2WI纹理分析在前列腺癌诊断中的初步应用
[J].
DCE-MRI and DWI can differentiate benign from malignant prostate tumors when serum PSA is ≥10 ng/mL
[J].
T2-weighted based radiomics model in differentiation of prostate cancer and benign prostate hyperplasia
[J].
基于T2WI的影像组学模型对鉴别前列腺癌和前列腺增生的诊断价值
[J].
Non-invasive MRI-based assessment of reactive stromal grade in prostate cancer using diffusion kurtosis imaging and stretched-exponential model
[J].DOI:10.1186/s12880-025-01881-0 [本文引用: 1]
Deep learning reconstruction of diffusion-weighted MRI improves image quality for prostatic imaging
[J].
DOI:10.1148/radiol.204097
PMID:35103536
[本文引用: 1]
Background Deep learning reconstruction (DLR) may improve image quality. However, its impact on diffusion-weighted imaging (DWI) of the prostate has yet to be assessed. Purpose To determine whether DLR can improve image quality of diffusion-weighted MRI at values ranging from 1000 sec/mm to 5000 sec/mm in patients with prostate cancer. Materials and Methods In this retrospective study, images of the prostate obtained at DWI with a value of 0 sec/mm, DWI with a value of 1000 sec/mm (DWI), DWI with a value of 3000 sec/mm (DWI), and DWI with a value of 5000 sec/mm (DWI) from consecutive patients with biopsy-proven cancer from January to June 2020 were reconstructed with and without DLR. Image quality was assessed using signal-to-noise ratio (SNR) and contrast-to-noise ratio (CNR) from region-of-interest analysis and qualitatively assessed using a five-point visual scoring system (1 [very poor] to 5 [excellent]) for each high--value DWI sequence with and without DLR. The SNR, CNR, and visual score for DWI with and without DLR were compared with the paired test and the Wilcoxon signed rank test with Bonferroni correction, respectively. Apparent diffusion coefficients (ADCs) from DWI with and without DLR were also compared with the paired test with Bonferroni correction. Results A total of 60 patients (mean age, 67 years; age range, 49-79 years) were analyzed. DWI with DLR showed significantly higher SNRs and CNRs than DWI without DLR (<.001); for example, with DWI the mean SNR was 38.7 ± 0.6 versus 17.8 ± 0.6, respectively (<.001), and the mean CNR was 18.4 ± 5.6 versus 7.4 ± 5.6, respectively (<.001). DWI with DLR also demonstrated higher qualitative image quality than DWI without DLR (mean score: 4.8 ± 0.4 vs 4.0 ± 0.7, respectively, with DWI [ =.001], 3.8 ± 0.7 vs 3.0 ± 0.8 with DWI [ =.002], and 3.1 ± 0.8 vs 2.0 ± 0.9 with DWI [<.001]). ADCs derived with and without DLR did not differ substantially (>.99). Conclusion Deep learning reconstruction improves the image quality of diffusion-weighted MRI scans of prostate cancer with no impact on apparent diffusion coefficient quantitation with a 3.0-T MRI system. © RSNA, 2022. See also the editorial by Turkbey in this issue.
The value of Bp-MRI grayscale histogram in distinguishing prostate cancer from benign prostatic hyperplasia in transition zone
[J].
Bp-MRI灰度直方图在鉴别移行带前列腺癌与良性前列腺增生中的应用价值
[J].
Application of radiomics based on T2WI in diagnosis of prostate cancer
[J].
基于磁共振T2WI的影像组学在前列腺癌诊断中的应用研究
[J].
The role of MRI diffusion weighted imaging in the diagnosis of benign prostatic hyperplasia and prostate cancer
[J].
核磁共振弥散加权成像在前列腺增生与前列腺癌诊断中的鉴别作用
[J].
Texture analysis of MR diffusion weighted imaging for discriminating high-grade from low-grade prostate cancer
[J].
基于DWI的纹理分析在鉴别高、低级别前列腺癌诊断中的价值
[J].
