胰腺自动分割与区域定量及糖尿病评估研究
Study on Pancreas Automatic Segmentation, Regional Quantification, and Diabetes Assessment
胰腺自动分割与区域定量及糖尿病评估研究 |
| 李英豪, 王丽辉, 王苏成, 朱中旗, 黄长栋, 李仁峰, 曹开明, 胡海洋, 贾一鸣, 梁松涛, 杨光, 路青, 汪红志 |
|
Study on Pancreas Automatic Segmentation, Regional Quantification, and Diabetes Assessment |
| LI Yinghao, WANG Lihui, WANG Sucheng, ZHU Zhongqi, HUANG Changdong, LI Renfeng, CAO Kaiming, HU Haiyang, JIA Yiming, LIANG Songtao, YANG Guang, LU Qing, WANG Hongzhi |
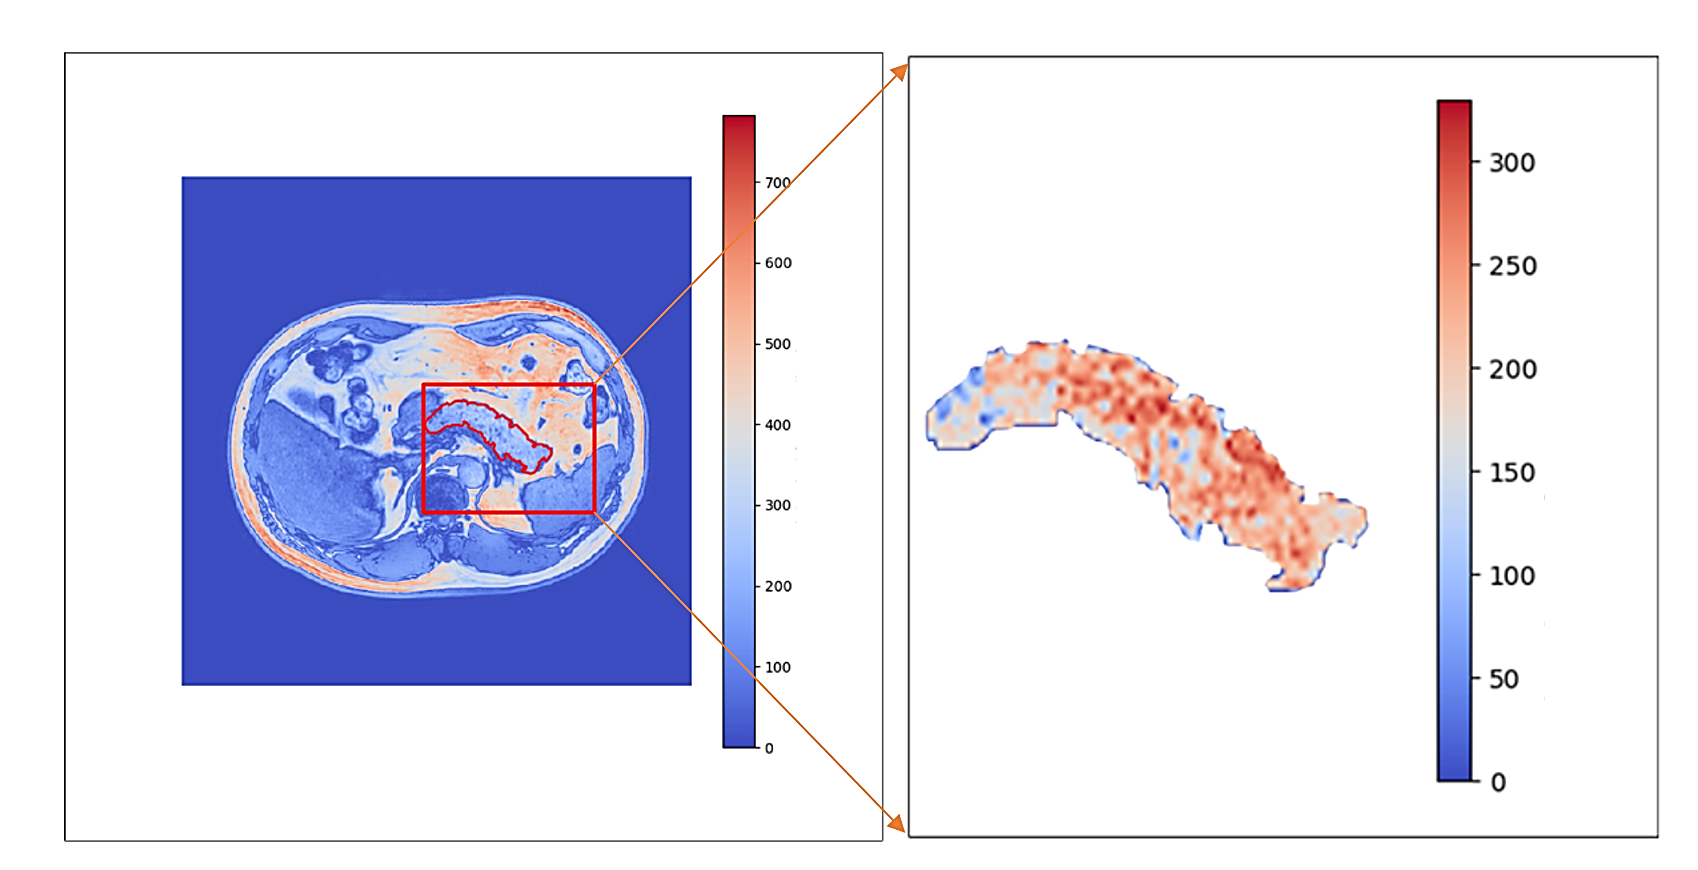
| 图4 腹腔及胰腺PDFF伪彩图中,坐标轴数值表示信号强度,颜色由蓝至红映射脂肪含量百分比,红色越深表示脂肪含量越高,蓝色越深则表示脂肪含量越低 |
| Fig. 4 The PDFF pseudo-color map of the abdomen and pancreas uses axis values to represent signal intensity. Color ranges from blue to red, indicating fat fraction—deeper red areas correspond to higher fat content, while deeper blue areas indicate lower fat content |
|
|