胰腺自动分割与区域定量及糖尿病评估研究
Study on Pancreas Automatic Segmentation, Regional Quantification, and Diabetes Assessment
胰腺自动分割与区域定量及糖尿病评估研究 |
| 李英豪, 王丽辉, 王苏成, 朱中旗, 黄长栋, 李仁峰, 曹开明, 胡海洋, 贾一鸣, 梁松涛, 杨光, 路青, 汪红志 |
|
Study on Pancreas Automatic Segmentation, Regional Quantification, and Diabetes Assessment |
| LI Yinghao, WANG Lihui, WANG Sucheng, ZHU Zhongqi, HUANG Changdong, LI Renfeng, CAO Kaiming, HU Haiyang, JIA Yiming, LIANG Songtao, YANG Guang, LU Qing, WANG Hongzhi |
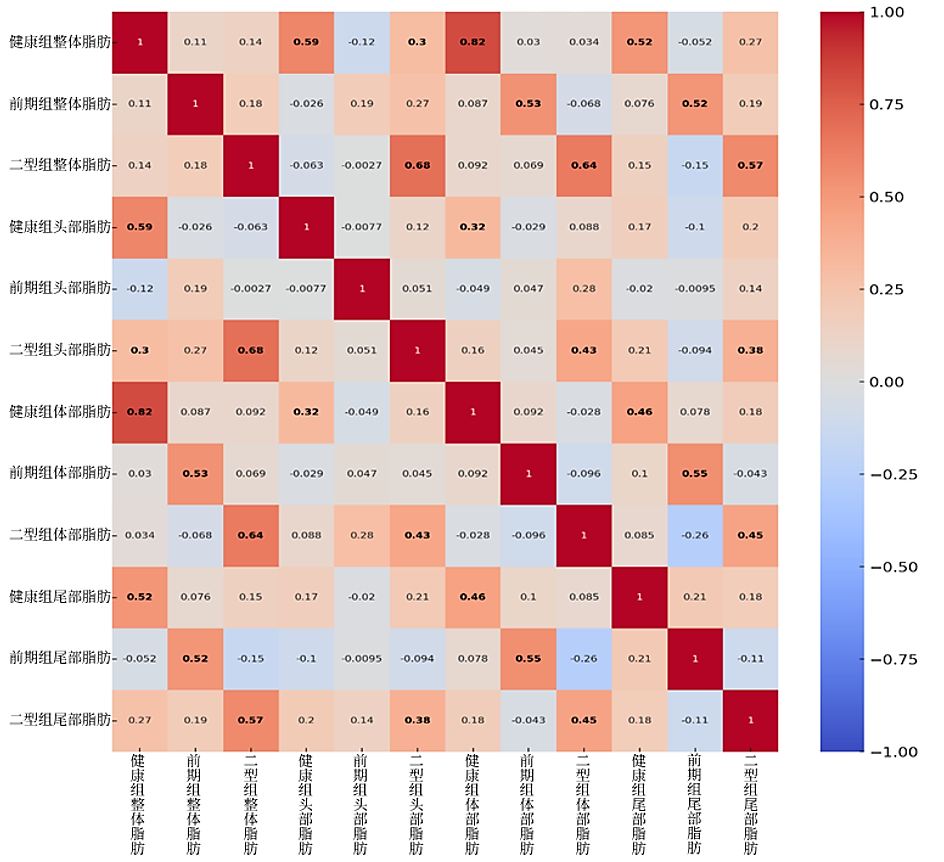
| 图7 三组患者胰腺各区域脂肪含量相关性分析图. 其中颜色由蓝至红映射相关性由0至1,其中健康、前期、2型组分别代表健康个体、糖尿病前期患者、T2DM患者 |
| Fig. 7 Correlation analysis map of fat content in different pancreatic regions across the three patient groups, with color ranging from blue to red representing correlation values from 0 to 1. The Healthy, Pre-diabetic, and Type 2 groups represent healthy individuals, pre-diabetic patients, and T2DM patients, respectively |
|
|