


引言
近年来,全球糖尿病患者数量持续攀升,预计到2050年将达到13.1亿人[1].糖尿病已成为严峻的公共卫生问题.胰腺在维持糖代谢平衡、调控胰岛素与胰高血糖素分泌中起关键作用,其功能异常是糖尿病发生的主要原因之一[2].胰腺脂肪浸润、炎症反应和氧化应激等因素被认为可能加剧胰岛素抵抗及β细胞功能衰竭[3].与此同时,不同解剖区域的胰岛结构和功能存在显著差异,这种空间异质性在糖尿病患者中尤为明显.Wang等[4]通过胰腺组织学分析发现,胰腺头部和体部的胰岛密度相似,而尾部区域的胰岛密度更高,且在2型糖尿病(Type 2 Diabetes Mellitus,T2DM)患者中,头部区域的大胰岛优先丢失. Sarma等[5]基于6点Dixon序列磁共振影像(Magnetic Resonance Imaging,MRI)结合区域生长算法计算胰腺不同区域的脂肪含量,并与磁共振波谱(Magnetic Resonance Spectroscopy,MRS)结果进行对比,发现T2DM患者的胰腺头部及体/尾部脂肪分数分别比健康个体高24.4%和24.0%.Nadarajah等[6]基于MRI影像手动勾画感兴趣区域(Region of Interest,ROI)分析发现,胰腺尾部脂肪含量增加能够有效识别T2DM高风险个体.这些研究均表明,糖尿病患者的胰腺不仅整体结构发生变化,不同解剖区域亦存在差异化的病理改变.因此,基于胰腺整体及分区的精细化定量分析,有助于深入理解糖尿病的发生发展机制,并优化个性化临床管理策略,对于糖尿病的早期诊断和干预具有重要意义.
近年来,深度学习技术的发展为胰腺影像分析带来了突破性进展.诸如U-Net、V-Net以及基于Transformer的模型能够自动提取胰腺的高维特征,实现更高精度的自动分割.已有研究中,Dai等[13]采用双解码与全局注意力上采样模块提高分割精度,Chen等[14]使用注意力机制增强提取上下文信息和学习独特特征的能力,Paithane等[15]则使用轻量级语义网络提高分割速度与精度,这些方法在一定程度上解决了胰腺边界模糊和解剖异质性问题.然而现有深度学习方法普遍依赖大量高质量标注数据,而胰腺MRI数据集获取困难且公开资源稀缺,使得模型泛化性和复现性受到影响.此外,多数研究关注胰腺整体分割,对如胰腺头、体、尾等局部区域内脂肪含量的定量分析较少,难以揭示不同区域与糖尿病之间的精细关联.
针对上述不足,本文开发了一种基于m-Dixon MRI数据的两阶段级联自动分割系统.该系统首先通过粗分割精确锁定胰腺的大致区域,然后结合精细分割模块实现对胰腺全貌及局部细节的高精度提取,从而有效应对胰腺结构复杂、多变的特点.与此同时,本文依据医学解剖比例经验,设计了一种基于三维旋转卡壳法的自动分区算法,提取胰腺在三维空间中的最大主轴方向,并在此基础上,将胰腺划分为头、体、尾三个区域,既确保了分区过程的几何稳定性,也充分符合胰腺的解剖结构特征.此一体化流程不仅完善了胰腺全区分割与局部分区的技术链条,更为基于影像的脂肪定量评估提供了精准手段,在糖尿病风险评估和精准干预方面具有丰富的应用前景.通过在高风险人群中的系统验证,本方法为深入揭示胰腺脂肪沉积与T2DM之间复杂关系提供了有力的技术支持.
1 实验部分
为实现胰腺的精准分割与特定区域的定量评估,本文提出了一套标注-分割-分析-预测方法,其主要流程如图1所示,首先对m-Dixon影像进行预处理以提高图像质量并进行归一化处理以构建标准数据集,再由影像科医师对MRI影像中的胰腺区域进行标注;完成数据集构建后使用级联的U-Net网络训练分割模型;使用最优模型获得完整分割后对三维胰腺使用旋转卡壳法确定体轴方向,通过旋转和变换,将胰腺区域在体轴上的投影划分为三个部分,从而实现头部、体部、尾部的自动划分;使用m-Dixon序列的水脂与体素信息对胰腺展开区域定量分析,寻找与T2DM关联特征;使用关联特征构建T2DM预测模型.
图1
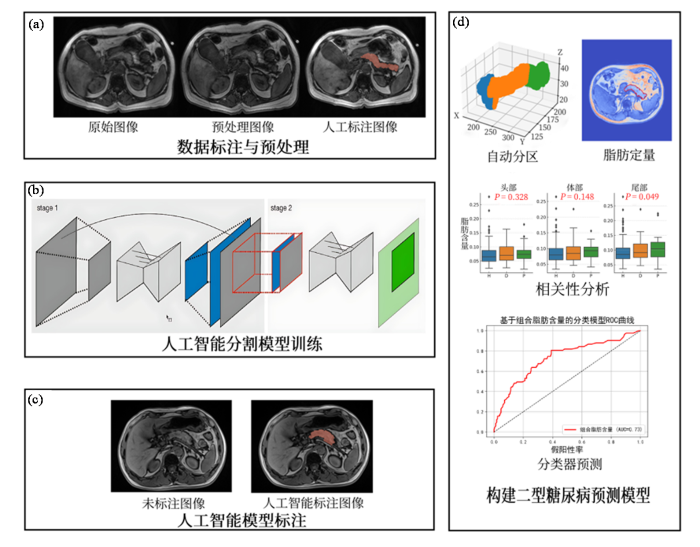
图1
本文研究流程图. (a)数据标注与预处理阶段;(b)人工智能分割模型训练阶段;(c)人工智能模型标注阶段;(d)构建2型糖尿病预测模型阶段
Fig. 1
Workflow of this study. (a) data annotation and preprocessing stage; (b) training stage of the artificial intelligence segmentation model; (c) annotation stage using the trained AI model; (d) construction stage of the T2DM prediction model
1.1 级联nnU-Net分割模型
尽管许多研究者通过优化网络结构提升胰腺分割精度,但相关研究[16]发现,DSC系数通常难以超过0.90,原因主要在于胰腺形态的个体差异性和解剖复杂性,这些特性难以通过简单的网络改进克服.此外,影像质量和成像技术的差异进一步增加了分割难度.本研究认为,尽管在网络结构优化方面取得了一些进展,但这种改进对分割精度的提升难以起到质变作用.同时,人工标注的主观性也是影响DSC系数稳定的关键因素,不同医生之间或同一医生在不同时间对同一病例的标注存在显著差异,导致分割精度难以保持一致.
在预实验中,对比nnU-Net[17]与经典U-Net、V-Net在胰腺分割任务中的表现,nnU-Net展现出显著优势(DSC : 0.90 vs 0.81/0.82).因此本文选择使用nnU-Net模型来实现胰腺的自动分割.nnU-Net作为一种自适应的深度学习框架,能够根据数据集的特性自动调整网络结构、预处理步骤以及训练策略,无需手动进行繁琐的参数优化.其核心优势在于:(1)自适应性强——能够根据不同数据集的形状、大小和维度自动配置最佳的网络架构;(2)全流程自动化——涵盖数据预处理、网络训练、推理和后处理的完整流程,极大降低了模型开发的复杂性;(3)卓越的分割性能——在多种医学图像分割任务中均取得了接近或超越人工标注的精度.因此,nnU-Net为胰腺这种形态复杂、边界模糊的器官分割提供了一种高效、稳定的解决方案.
具体而言,本研究采用级联nnU-Net模型进行胰腺自动分割,网络结构如图2所示.模型包含两个阶段:首先,第一级3D U-Net在重采样后的低分辨率图像(low res. image)上训练,生成粗略分割(low res. seg.);随后将其上采样至原始分辨率(full res. seg.),并作为额外通道输入第二级全分辨率3D U-Net,在全分辨率图像上进一步精细分割.全流程采用基于图像块的训练策略,patch大小为48×192×224,网络采用六级编码器结构,每级包含两个3×3×3卷积层,最大特征通道数设为320.预处理步骤包括前景裁剪、空间重采样(spacing: [2.20,0.82,0.82]mm)以及基于非零区域的Z-score强度归一化.训练使用五折交叉验证,损失函数为交叉熵与DSC Loss的加权和(各占50%),优化器为Adam,初始学习率为0.01,训练过程中逐步衰减,并每100 epoch保存一次最佳模型.实验在Ubuntu 20.04系统搭载GeForce RTX 3060Ti显卡的环境下完成.
图2

DSC是两个集合之间相似度的度量.在图像分割任务中,经常使用DSC来评估预测分割结果与真实分割结果之间的相似性,其计算公式如(1)式所示:
其中,TP代表真阳性(预测为阳性,实际为阳性),FP代表假阳性(预测为阳性,但实际为阴性),FN代表假阴性(预测为阴性,但实际为阳性),DSC值的范围从0到1,1表示完全匹配,0表示完全不匹配.DSC值越大,表明预测的分割结果与真实的分割结果相似度越高,表明模型的分割性能越好.
1.2 胰腺自动分区算法
在完成胰腺的整体分割后,系统进一步对胰腺区域进行轴向划分.该过程的目的是将胰腺分为头部、体部和尾部三个区域,以便进行更精确的定量分析.
首先,系统通过改进的三维旋转卡壳法计算胰腺区域在X、Y、Z三个坐标轴方向上的最大距离,确定胰腺区域的矩形凸包.然后找到该凸包的主轴方向,作为胰腺的体轴.该方法基于胰腺区域的凸包边界,能够精确地计算出胰腺的主要轴向.
在得到胰腺的体轴后,参照Sulochana等[18]解剖结果系统使用预设的比例线(基于该主轴切线方向)将胰腺按照13 : 10 : 5比例分为头部、体部和尾部.具体地,系统通过旋转和变换,将胰腺区域在体轴上的投影划分为三个部分,从而实现头部、体部和尾部的自动化划分.这种基于旋转卡壳法的划分方法不仅考虑了胰腺的解剖学特征,还能有效减少人工干预,确保每个区域的划分合理且符合临床实际.
为了进一步确保划分结果的准确性,本研究邀请了专业影像医生对初步划分结果进行评估.医生通过交互操作,对分割比例进行调整,并确认划分结果的合理性.医生的参与提高了分割结果的准确度,确保其符合临床应用需求,两种不同类型胰腺自动分区如图3所示.
图3
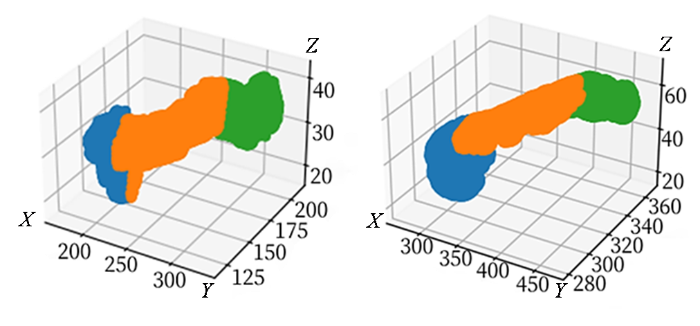
图3
胰腺自动分区结果演示图. 图中长度均为毫米. 蓝、橙、绿分别代表尾部、体部、头部
Fig. 3
Pancreas automatic partitioning demonstration. The lengths in the diagram are all in millimeters. Blue, orange and green represent the tail, body and head respectively
1.3 胰腺区域定量
本研究使用的m-Dixon序列利用水脂信号的化学位移差异进行图像重建,能够生成水相图像和脂肪相图像.从而计算出脂肪分数图,即脂肪信号强度在总信号强度中的比例.这一脂肪分数计算方法已被广泛应用于多种临床研究和疾病评估中.Kukuk等[19]通过研究证明,使用Dixon序列生成的质子密度脂肪分数图像(Proton Density Fat Fraction,PDFF)与肝脏脂肪量化的金标准MRS具有高度一致性,验证了Dixon序列作为脂肪量化方法的可靠性.
MRI提供了高分辨率的软组织成像能力,使得对器官或组织的体积进行精确测量成为可能.基于MRI进行体积计算的基本原理是通过三维成像获取连续的切面图像,并根据每个切面上的像素面积和切片厚度进行积分求和,从而得到目标区域的总体积.为了提高批量数据处理的效率并实现更灵活的图像分析,本研究使用Python语言开发了一套自动化的后处理算法,实现了标记区域体积的自动计算,并将其与专业磁共振处理软件3D-Slice[20]体积计算结果比对确认,确保了算法生成图像的可靠性和准确性.
同时本研究使用Python语言开发了一套自动化的后处理算法,依据m-Dixon序列水-脂-同相-反相图像计算得到PDFF图像,并将其与影像科医师在工作站上生成的PDFF图像进行比对确认,确保了算法生成图像的可靠性和准确性,图4为生成的PDFF伪彩图.这种方法不仅提高了数据处理的效率,还为后续的大规模数据分析和模型训练提供了可靠的数据基础.
图4

图4
腹腔及胰腺PDFF伪彩图中,坐标轴数值表示信号强度,颜色由蓝至红映射脂肪含量百分比,红色越深表示脂肪含量越高,蓝色越深则表示脂肪含量越低
Fig. 4
The PDFF pseudo-color map of the abdomen and pancreas uses axis values to represent signal intensity. Color ranges from blue to red, indicating fat fraction—deeper red areas correspond to higher fat content, while deeper blue areas indicate lower fat content
2 测试与讨论
2.1 实验数据集
本研究的数据来源于一项横断面研究,该研究最初纳入了256名受试者(151名健康个体对照组、63名糖调节受损者和42名T2DM患者),这些受试者在2020年1月~2022年12月期间在上海市东方医院接受了m-Dixon技术进行的MRI扫描.该研究已经获得了医院伦理审查委员会的批准(批准编号EC.D(BG).026.04.0).研究的纳入标准包括:年龄在18~69岁之间,体重指数(Body Mass Index,BMI)≥ 24 kg/m²,且患者具备完整的病史和实验室检查结果,并且没有MRI检查的禁忌症.排除标准则包括:存在任何形式的胰腺疾病(如胰腺炎、胰腺肿瘤或自身免疫性疾病);其他内分泌和代谢性疾病(如1型糖尿病、甲状腺功能减退、库欣综合征和垂体功能障碍);影像不完整或图像存在伪影;以及缺乏完整的实验室检查结果.MRI扫描使用的是Philips Ingenia 3.0T系统,并采用了改进的6点m-Dixon序列.参与者在成像前需要禁食8~10 h,并保持仰卧位进行扫描.扫描参数包括:重复时间15 ms,翻转角度3˚,切片厚度3 mm.生成了四种定量图谱(包括水、脂肪、同相和反向),训练过程使用四种图像进行多模态训练.图像的预处理过程包括去噪、强度标准化和对比度调整等步骤,以确保图像的质量和一致性.为了构建训练数据集,五名经验丰富的放射科医生使用3D Slicer(v5.0.1)对胰腺进行手动标注.标注任务在放射科医生之间进行了随机分配,并且每个医生在标注时都遵循了统一的标注规范.训练过程使用五折交叉法随机分配训练集与验证集.
2.2 基于nnU-Net的分割结果
表1 分割结果对照表
Table 1
图5
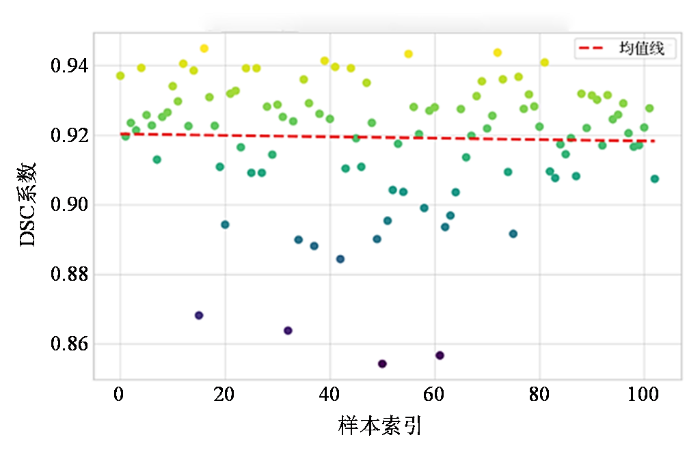
图5
分割结果DSC系数散点图
Fig. 5
Scatter plot of DSC coefficients for segmentation results
图6
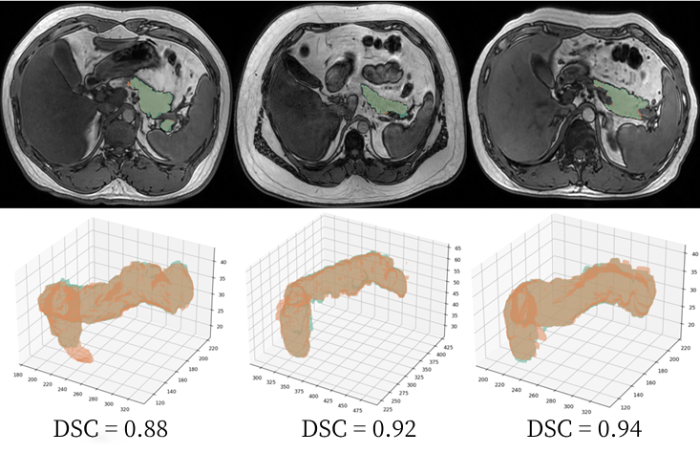
图6
部分分割结果展示图. 绿色部分为影像科医生标注,红色部分为模型标注
Fig. 6
Demonstration of partial segmentation results. The green region represents annotations by radiologists, and the red region represents model annotations
2.3 基于分割结果的自动分区与定量评估
本研究依据世界卫生组织推荐葡萄糖耐受量标准将256名受试者分为三组:151名健康个体(正常葡萄糖耐受量),63名糖尿病前期患者(糖调节受损)和42名T2DM患者.对其MRI图像进行了胰腺体积和脂肪含量的定量计算.此外,本研究还评估了这些指标与糖尿病之间的相关性.
首先,本研究使用皮尔逊相关系数(r)评估了不同组别(健康个体、糖尿病前期患者、T2DM患者)胰腺各个区域(头部、体部、尾部)脂肪含量之间的相关性.图7为不同组别和胰腺各部位之间的相关性分析结果.在健康组和T2DM组中,总脂肪含量与胰腺头部(健康组r = 0.59, p = 3.62×10⁻5;T2DM组r = 0.68, p = 4.43×10⁻7,r即皮尔逊相关系数,p为显著性水平)、体部(健康组r = 0.82, p = 1.54×10⁻11;T2DM组r = 0.64, p = 3.71×10⁻6)和尾部脂肪(健康组r = 0.52, p = 3.57×10⁻4;T2DM组r = 0.57, p = 6.14×10⁻5)之间存在显著的相关性.然而,糖尿病前期组仅在总脂肪与体部(r = 0.53, p = 2.28×10⁻4)和尾部脂肪(r = 0.52, p = 3.69×10⁻4)之间存在显著相关性.结果显示,无论是健康组还是T2DM组,总脂肪含量与胰腺头部、体部和尾部的脂肪含量之间均存在显著正相关关系,且体部的相关性最强(如健康组 r = 0.82, p = 1.54×10⁻11),说明体部脂肪含量与总脂肪水平的线性关系最为紧密.相比之下,糖尿病前期组仅在体部和尾部脂肪与总脂肪之间呈现显著正相关,而在头部脂肪含量上未观察到统计学显著相关性,提示其脂肪分布模式可能具有阶段性差异或区域特异性.这可能表明,在糖尿病的前期阶段,胰腺不同区域脂肪的代谢积累具有异质性.随着时间的推移,这种差异逐渐减小.这个结果与Nadarajah等[6]的研究一致,故推测与胰腺尾部的β-胰岛细胞密度较高有关,而尾部与胰腺头部或体部相比更容易发生脂肪积累. Skudder-Hill等[25]的研究也表明,胰腺脂肪沉积和胰岛素抵抗的病理生理过程最初发生在胰腺尾部和体部,而不是胰腺头部.
图7
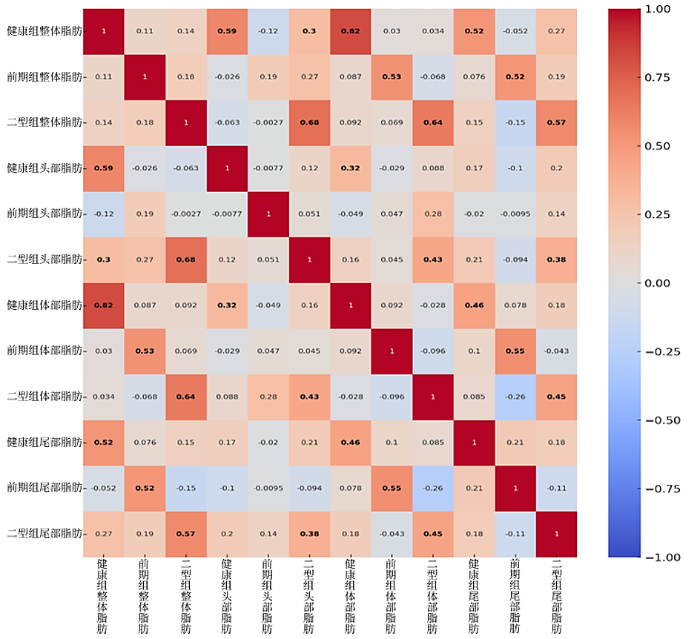
图7
三组患者胰腺各区域脂肪含量相关性分析图. 其中颜色由蓝至红映射相关性由0至1,其中健康、前期、2型组分别代表健康个体、糖尿病前期患者、T2DM患者
Fig. 7
Correlation analysis map of fat content in different pancreatic regions across the three patient groups, with color ranging from blue to red representing correlation values from 0 to 1. The Healthy, Pre-diabetic, and Type 2 groups represent healthy individuals, pre-diabetic patients, and T2DM patients, respectively
图8
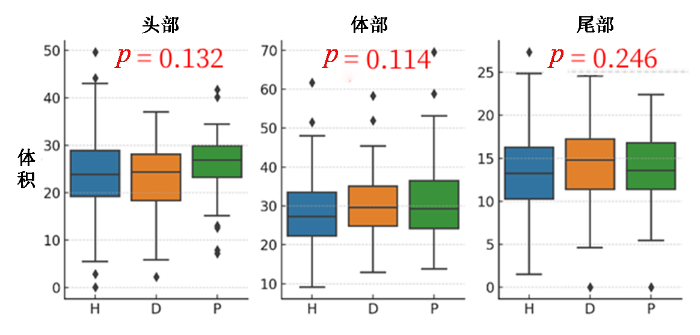
图8
胰腺头、体、尾体积分布与糖尿病相关性图. H、D、P分别代表健康个体、T2DM患者和糖尿病前期患者
Fig. 8
Correlation between the volume distribution of the pancreatic head, body, and tail and diabetes. H, D, P represents healthy individuals, diabetic, and prediabetic patients, respectively
图9
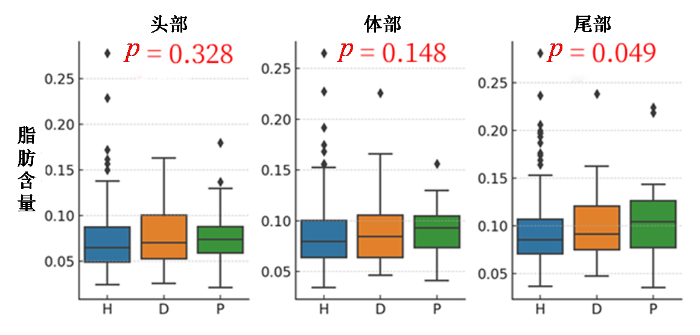
图9
胰腺头、体、尾脂肪含量分布与糖尿病相关性图. H、D、P分别代表健康个体、T2DM患者和糖尿病前期患者
Fig. 9
Correlation between the fat content distribution of the pancreatic head, body, and tail and diabetes. H, D, P represents healthy individuals, diabetic, and prediabetic patients, respectively
2.4 糖尿病早期诊断模型构建
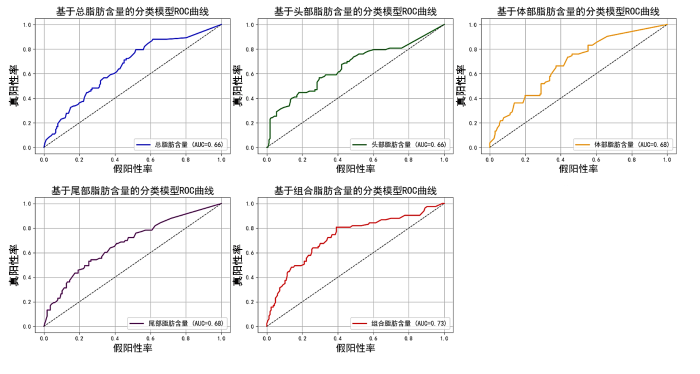
在本研究中,我们构建了五个随机森林模型,以评估三组患者(健康个体、糖尿病前期患者和T2DM患者)的分类性能,评估结果如图10所示.这些模型分别基于不同的特征组合:第1个模型仅使用整个胰腺的总脂肪含量作为特征,通过计算胰腺整体的平均脂肪含量来评估其与糖尿病状态的相关性;第2个模型仅使用胰腺头部的脂肪含量作为特征,分析头部脂肪含量与糖尿病状态的关系;第3个模型基于胰腺体部的脂肪含量,评估体部脂肪含量与糖尿病状态的相关性;第4个模型则专注于胰腺尾部的脂肪含量,分析尾部脂肪含量与糖尿病状态的关联.第5个模型结合了整个胰腺、头部、体部和尾部的脂肪含量作为特征,通过综合分析胰腺不同区域的脂肪含量,评估其对糖尿病状态的分类能力.我们使用AUC评估每个模型的性能,其中AUC值越接近1,表示分类器的性能越好.分类评估结果表明,基于组合特征的模型(模型5)在糖尿病早期诊断中表现最佳,其AUC值为0.73,高于基于单一特征的模型.这表明,综合考虑胰腺不同区域的脂肪含量,可以更准确地预测糖尿病风险,为糖尿病的早期筛查和个性化干预提供了新的视角和方法.
图10
2.5 讨论
本研究相较于现有方法相比(如Li等[22]基于自动提取m-Dixon Quant值的胰腺ROI分析),本研究采用了五位放射科专家手动标注的高质量训练数据,并利用nnU-Net深度学习网络实现了胰腺的高精度自动分割与区域化.与传统的经验位置或轴向投影分区方法不同,本研究提出的基于旋转卡壳法和主轴投影结合解剖学比例的自动划分策略,在几何稳定性和解剖一致性方面更具优势,能够有效避免因胰腺形态变化带来的划分误差,并提高了划分的自适应性和空间鲁棒性.此外,为确保临床应用的可用性,本研究引入专业影像医生参与划分结果的微调和确认,所有结果均通过医生一致性评估,验证了方法的稳定性和可靠性.这一流程实现了人工知识与算法的有机融合,显著提高了方法在临床中的实用性.
与传统ROI分析相比,本研究通过区域分割、脂肪定量与分类建模构建了可追踪、可解释的糖尿病辅助评估路径.不同于“黑箱”型模型,本研究采用随机森林算法,其特征重要性分析明确揭示了胰腺各区域脂肪含量对糖尿病预测的贡献,尤其是胰腺尾部脂肪含量,进一步支持了“胰腺尾部脂肪积聚与β细胞功能下降相关”的结论.这一整体流程不仅提高了糖尿病发病机制的可量化、可追溯性,还增强了模型的临床解释力与应用潜力.
本研究仍存在以下不足:首先,研究仅基于中国人群,缺乏多种族验证,限制了结果的普适性.其次,数据采集依赖单一型号3.0T MRI设备,不同设备和成像协议可能影响分割和定量结果的一致性.此外,胰腺区域划分目前尚无统一金标准,存在一定主观性,建议未来探索更标准化的划分方法.研究还缺乏多中心、长期随访的数据支持,难以确证脂肪变化与糖尿病发展的因果关系.最后,后续可结合多模态影像与更先进的分割模型,提升模型的泛化能力和临床适用性.
3 结论
本研究基于m-Dixon MRI构建了融合胰腺自动分割、区域划分、脂肪定量与糖尿病评估的一体化分析流程.依托专家标注数据与级联nnU-Net网络,实现了高精度胰腺及区域自动分割,并提出基于旋转卡壳法的区域划分策略,兼顾几何稳定性与解剖一致性.研究在256例亚洲高风险人群中系统分析了不同类型胰腺脂肪与T2DM的关联,发现胰尾脂肪含量(PTF)与T2DM显著相关.进一步结合随机森林模型构建可解释的辅助评估路径,明确脂肪区域特征对糖尿病预测的贡献.为糖尿病的早筛与个体化干预提供了可推广的技术支撑.
利益冲突
无
参考文献
Global, regional, and national burden of diabetes from 1990 to 2021, with projections of prevalence to 2050: a systematic analysis for the Global Burden of Disease Study 2021
[J].
DOI:10.1016/S0140-6736(23)01301-6
PMID:37356446
[本文引用: 1]

Diabetes is one of the leading causes of death and disability worldwide, and affects people regardless of country, age group, or sex. Using the most recent evidentiary and analytical framework from the Global Burden of Diseases, Injuries, and Risk Factors Study (GBD), we produced location-specific, age-specific, and sex-specific estimates of diabetes prevalence and burden from 1990 to 2021, the proportion of type 1 and type 2 diabetes in 2021, the proportion of the type 2 diabetes burden attributable to selected risk factors, and projections of diabetes prevalence through 2050.Estimates of diabetes prevalence and burden were computed in 204 countries and territories, across 25 age groups, for males and females separately and combined; these estimates comprised lost years of healthy life, measured in disability-adjusted life-years (DALYs; defined as the sum of years of life lost [YLLs] and years lived with disability [YLDs]). We used the Cause of Death Ensemble model (CODEm) approach to estimate deaths due to diabetes, incorporating 25 666 location-years of data from vital registration and verbal autopsy reports in separate total (including both type 1 and type 2 diabetes) and type-specific models. Other forms of diabetes, including gestational and monogenic diabetes, were not explicitly modelled. Total and type 1 diabetes prevalence was estimated by use of a Bayesian meta-regression modelling tool, DisMod-MR 2.1, to analyse 1527 location-years of data from the scientific literature, survey microdata, and insurance claims; type 2 diabetes estimates were computed by subtracting type 1 diabetes from total estimates. Mortality and prevalence estimates, along with standard life expectancy and disability weights, were used to calculate YLLs, YLDs, and DALYs. When appropriate, we extrapolated estimates to a hypothetical population with a standardised age structure to allow comparison in populations with different age structures. We used the comparative risk assessment framework to estimate the risk-attributable type 2 diabetes burden for 16 risk factors falling under risk categories including environmental and occupational factors, tobacco use, high alcohol use, high body-mass index (BMI), dietary factors, and low physical activity. Using a regression framework, we forecast type 1 and type 2 diabetes prevalence through 2050 with Socio-demographic Index (SDI) and high BMI as predictors, respectively.In 2021, there were 529 million (95% uncertainty interval [UI] 500-564) people living with diabetes worldwide, and the global age-standardised total diabetes prevalence was 6·1% (5·8-6·5). At the super-region level, the highest age-standardised rates were observed in north Africa and the Middle East (9·3% [8·7-9·9]) and, at the regional level, in Oceania (12·3% [11·5-13·0]). Nationally, Qatar had the world's highest age-specific prevalence of diabetes, at 76·1% (73·1-79·5) in individuals aged 75-79 years. Total diabetes prevalence-especially among older adults-primarily reflects type 2 diabetes, which in 2021 accounted for 96·0% (95·1-96·8) of diabetes cases and 95·4% (94·9-95·9) of diabetes DALYs worldwide. In 2021, 52·2% (25·5-71·8) of global type 2 diabetes DALYs were attributable to high BMI. The contribution of high BMI to type 2 diabetes DALYs rose by 24·3% (18·5-30·4) worldwide between 1990 and 2021. By 2050, more than 1·31 billion (1·22-1·39) people are projected to have diabetes, with expected age-standardised total diabetes prevalence rates greater than 10% in two super-regions: 16·8% (16·1-17·6) in north Africa and the Middle East and 11·3% (10·8-11·9) in Latin America and Caribbean. By 2050, 89 (43·6%) of 204 countries and territories will have an age-standardised rate greater than 10%.Diabetes remains a substantial public health issue. Type 2 diabetes, which makes up the bulk of diabetes cases, is largely preventable and, in some cases, potentially reversible if identified and managed early in the disease course. However, all evidence indicates that diabetes prevalence is increasing worldwide, primarily due to a rise in obesity caused by multiple factors. Preventing and controlling type 2 diabetes remains an ongoing challenge. It is essential to better understand disparities in risk factor profiles and diabetes burden across populations, to inform strategies to successfully control diabetes risk factors within the context of multiple and complex drivers.Bill & Melinda Gates Foundation.Copyright © 2023 The Author(s). Published by Elsevier Ltd. This is an Open Access article under the CC BY 4.0 license. Published by Elsevier Ltd.. All rights reserved.
Understanding the cause of type 2 diabetes
[J].DOI:10.1016/S2213-8587(24)00157-8 URL [本文引用: 1]
Regional differences in islet distribution in the human pancreas-preferential beta-cell loss in the head region in patients with type 2 diabetes
[J].DOI:10.1371/journal.pone.0067454 URL [本文引用: 1]
Noninvasive assessment of abdominal adipose tissues and quantification of hepatic and pancreatic fat fractions in type 2 diabetes mellitus
[J].
DOI:S0730-725X(20)30326-X
PMID:32668273
[本文引用: 1]
The purpose of this study was to evaluate adipose tissue distributions and hepatic and pancreatic fat contents using a 6-point Dixon MRI technique in type 2 diabetes mellitus (T2DM), and to assess associations between fat distributions and biochemical markers of insulin resistance. Intra-abdominal MRI was investigated in 14 T2DM patients, 13 age- and sex-matched healthy controls (HC) and 11 young HC using a 3 T Prisma MRI scanner. All T2DM subjects completed a fasting comprehensive metabolic panel, and demographic measurements were taken according to standardized methodologies. We observed excellent correlation (R = 0.94) between hepatic fat fraction quantified using 6-point Dixon MRI and gold standard MRS, establishing the accuracy and reliability of the Dixon technique. Significantly increased visceral adipose tissue (VAT) volumes were found in T2DM patients compared to age-matched HC (1569.81 ± 670.62 cm vs. 1106.60 ± 566.85 cm, p = .04). We also observed a trend of increasing subcutaneous adipose tissues (SAT), and total abdominal fat (TAT) volumes in T2DM compared to age-matched HC. Hepatic fat fraction percentage (HFF%) was 44.6% higher in T2DM compared to age-matched HC and 64.4% higher compared to young HC. Pancreatic fat fractions in the head and body/tail were higher in T2DM patients compared to both healthy cohorts. We also observed correlations between fat contents of the liver and pancreas in T2DM patients, and association between biochemical markers of T2DM with HFF, indicating a risk for non-alcoholic fatty liver disease among T2DM. In summary, this study provides evidence of T2DM patients having increased liver and pancreatic fat, as well as increased adipose tissues.Copyright © 2020 Elsevier Inc. All rights reserved.
Association of pancreatic fat content with type II diabetes mellitus
[J].
DOI:S0009-9260(19)30269-7
PMID:31711639
[本文引用: 2]
To determine the association between regional fat content in the pancreas and the presence or absence of type II diabetes mellitus (T2DM), the value of regional pancreatic fat quantification in identifying patients at risk of T2DM, and whether pancreatic fat content is associated with glycaemic control in T2DM.A retrospective survey of a radiology database identified 45 patients with T2DM, and 81 "at risk for T2DM" patients who developed diabetes, between 0.6 and 3.7 years after magnetic resonance imaging (MRI). A control group who did not develop diabetes during a 5-year follow-up and without known metabolic syndrome, liver, or pancreatic diseases were also identified. Fat content was measured by placing regions of interest (ROIs) on in-phase and out-of-phase chemical shift MRI images. Multiple clinical parameters including body mass index, cholesterol levels, blood pressure, glycated haemoglobin (HbA1c; in T2DM group) were collected.There was a significant difference between the T2DM and control groups for fat fraction in the pancreatic head (p=0.043), body (p=0.015), and tail (p=0.001), but not liver (p=0.107). On regression analysis, only the fat fraction within the pancreatic tail was significantly different between control group and "at risk" for T2DM group (p=0.007). A pancreatic tail fat content of >10% had a sensitivity of 45.5% and specificity of 81.3% for predicting development of T2DM within 4 years. Pancreatic fat content was not associated with glycaemic control.Increased fat in the pancreatic tail may identify patients at risk for T2DM.Copyright © 2019 The Royal College of Radiologists. Published by Elsevier Ltd. All rights reserved.
Automatic segmentation of abdominal organs and adipose tissue compartments in water-fat MRI: application to weight-loss in obesity
[J].
DOI:10.1016/j.ejrad.2016.06.006
PMID:27501897
[本文引用: 1]
To develop a fully automatic algorithm for abdominal organs and adipose tissue compartments segmentation and to assess organ and adipose tissue volume changes in longitudinal water-fat magnetic resonance imaging (MRI) data.Axial two-point Dixon images were acquired in 20 obese women (age range 24-65, BMI 34.9±3.8kg/m(2)) before and after a four-week calorie restriction. Abdominal organs, subcutaneous adipose tissue (SAT) compartments (abdominal, anterior, posterior), SAT regions along the feet-head direction and regional visceral adipose tissue (VAT) were assessed by a fully automatic algorithm using morphological operations and a multi-atlas-based segmentation method.The accuracy of organ segmentation represented by Dice coefficients ranged from 0.672±0.155 for the pancreas to 0.943±0.023 for the liver. Abdominal SAT changes were significantly greater in the posterior than the anterior SAT compartment (-11.4%±5.1% versus -9.5%±6.3%, p<0.001). The loss of VAT that was not located around any organ (-16.1%±8.9%) was significantly greater than the loss of VAT 5cm around liver, left and right kidney, spleen, and pancreas (p<0.05).The presented fully automatic algorithm showed good performance in abdominal adipose tissue and organ segmentation, and allowed the detection of SAT and VAT subcompartments changes during weight loss.Copyright © 2016 Elsevier Ireland Ltd. All rights reserved.
Automated abdominal multi-organ segmentation with subject-specific atlas generation
[J].DOI:10.1109/TMI.2013.2265805 URL
Multi-organ segmentation based on spatially-divided probabilistic atlas from 3D abdominal CT images
[C]//
Joint optimization of segmentation and shape prior from level-set-based statistical shape model, and its application to the automated segmentation of abdominal organs
[J].
DOI:10.1016/j.media.2015.11.003
PMID:26716720
The goal of this study is to provide a theoretical framework for accurately optimizing the segmentation energy considering all of the possible shapes generated from the level-set-based statistical shape model (SSM). The proposed algorithm solves the well-known open problem, in which a shape prior may not be optimal in terms of an objective functional that needs to be minimized during segmentation. The algorithm allows the selection of an optimal shape prior from among all possible shapes generated from an SSM by conducting a branch-and-bound search over an eigenshape space. The proposed algorithm does not require predefined shape templates or the construction of a hierarchical clustering tree before graph-cut segmentation. It jointly optimizes an objective functional in terms of both the shape prior and segmentation labeling, and finds an optimal solution by considering all possible shapes generated from an SSM. We apply the proposed algorithm to both pancreas and spleen segmentation using multiphase computed tomography volumes, and we compare the results obtained with those produced by a conventional algorithm employing a branch-and-bound search over a search tree of predefined shapes, which were sampled discretely from an SSM. The proposed algorithm significantly improves the segmentation performance in terms of the Jaccard index and Dice similarity index. In addition, we compare the results with the state-of-the-art multiple abdominal organs segmentation algorithm, and confirmed that the performances of both algorithms are comparable to each other. We discuss the high computational efficiency of the proposed algorithm, which was determined experimentally using a normalized number of traversed nodes in a search tree, and the extensibility of the proposed algorithm to other SSMs or energy functionals. Copyright © 2015 Elsevier B.V. All rights reserved.
Pancreatic cystic neoplasms segmentation network combining dual decoding and global attention upsampling modules
[J].
融合双解码和全局注意力上采样模块的胰腺囊性肿瘤分割网络
[J].
DOI:10.11938/cjmr20233073
[本文引用: 1]
胰腺因其解剖结构复杂多变、周围环境复杂等特点,始终是医学图像分割中最具挑战性的任务之一.针对以上问题,提出一种融合双解码和全局注意力上采样模块的深度学习分割模型(Combining Dual Decoding and Global Attention Upsampling Modules Network,DGANet).模型由一个编码器和两个解码器构成,两个解码器实现了对不同深度特征信息的充分利用;模型采用全局注意力上采样模块(Global Attention Upsampling,GAU),利用高层丰富的语义信息来引导低层选择更为精准的特征信息.利用长海医院提供的数据集进行实验,结果表明平均Dice相似系数为86.28%,交并比(Intersection-over-Union,IoU)为0.77,豪斯多夫距离(Hausdorff Distance,HD)为7.7 mm,数据证实了该模型在胰腺囊性肿瘤分割中具有一定的临床意义和价值.
CTUNet: automatic pancreas segmentation using a channel-wise transformer and 3D U-Net
[J].DOI:10.1007/s00371-022-02656-2 [本文引用: 1]
LMNS-Net: Lightweight multiscale novel semantic-net deep learning approach used for automatic pancreas image segmentation in CT scan images
[J].DOI:10.1016/j.eswa.2023.121064 URL [本文引用: 2]
Automatic segmentation of pancreas and pancreatic tumor: a review of a decade of research
[J].DOI:10.1109/ACCESS.2023.3320570 URL [本文引用: 2]
nnU-Net: a self-configuring method for deep learning-based biomedical image segmentation
[J].
DOI:10.1038/s41592-020-01008-z
PMID:33288961
[本文引用: 3]
Biomedical imaging is a driver of scientific discovery and a core component of medical care and is being stimulated by the field of deep learning. While semantic segmentation algorithms enable image analysis and quantification in many applications, the design of respective specialized solutions is non-trivial and highly dependent on dataset properties and hardware conditions. We developed nnU-Net, a deep learning-based segmentation method that automatically configures itself, including preprocessing, network architecture, training and post-processing for any new task. The key design choices in this process are modeled as a set of fixed parameters, interdependent rules and empirical decisions. Without manual intervention, nnU-Net surpasses most existing approaches, including highly specialized solutions on 23 public datasets used in international biomedical segmentation competitions. We make nnU-Net publicly available as an out-of-the-box tool, rendering state-of-the-art segmentation accessible to a broad audience by requiring neither expert knowledge nor computing resources beyond standard network training.
A gross morphological study of the pancreas in human cadavers
[J].DOI:10.4103/2277-4025.298007 URL [本文引用: 1]
Comparison between modified Dixon MRI techniques, MR spectroscopic relaxometry, and different histologic quantification methods in the assessment of hepatic steatosis
[J].
DOI:10.1007/s00330-015-3703-6
PMID:25903702
[本文引用: 1]
To compare systematically quantitative MRI, MR spectroscopy (MRS), and different histological methods for liver fat quantification in order to identify possible incongruities.Fifty-nine consecutive patients with liver disorders were examined on a 3 T MRI system. Quantitative MRI was performed using a dual- and a six-echo variant of the modified Dixon (mDixon) sequence, calculating proton density fat fraction (PDFF) maps, in addition to single-voxel MRS. Histological fat quantification included estimation of the percentage of hepatocytes containing fat vesicles as well as semi-automatic quantification (qHisto) using tissue quantification software.In 33 of 59 patients, the hepatic fat fraction was >5% as determined by MRS (maximum 45%, mean 17%). Dual-echo mDixon yielded systematically lower PDFF values than six-echo mDixon (mean difference 1.0%; P < 0.001). Six-echo mDixon correlated excellently with MRS, qHisto, and the estimated percentage of hepatocytes containing fat vesicles (R = 0.984, 0.967, 0.941, respectively, all P < 0.001). Mean values obtained by the estimated percentage of hepatocytes containing fat were higher by a factor of 2.5 in comparison to qHisto. Six-echo mDixon and MRS showed the best agreement with values obtained by qHisto.Six-echo mDixon, MRS, and qHisto provide the most robust and congruent results and are therefore most appropriate for reliable quantification of liver fat.• Six-echo mDixon correlates excellently with MRS, qHisto, and the estimated percentage of fat-containing hepatocytes. • Six-echo mDixon, MRS, and qHisto provide the most robust and congruent results. • Dual-echo mDixon yields systematically lower PDFF values than six-echo mDixon. • The percentage of fat-containing hepatocytes is 2.5-fold higher than fat fraction determined by qHisto. • Performance characteristics and systematic differences of the various methods should be considered.
3D Slicer as an image computing platform for the Quantitative Imaging Network
[J].
DOI:10.1016/j.mri.2012.05.001
PMID:22770690
[本文引用: 1]
Quantitative analysis has tremendous but mostly unrealized potential in healthcare to support objective and accurate interpretation of the clinical imaging. In 2008, the National Cancer Institute began building the Quantitative Imaging Network (QIN) initiative with the goal of advancing quantitative imaging in the context of personalized therapy and evaluation of treatment response. Computerized analysis is an important component contributing to reproducibility and efficiency of the quantitative imaging techniques. The success of quantitative imaging is contingent on robust analysis methods and software tools to bring these methods from bench to bedside. 3D Slicer is a free open-source software application for medical image computing. As a clinical research tool, 3D Slicer is similar to a radiology workstation that supports versatile visualizations but also provides advanced functionality such as automated segmentation and registration for a variety of application domains. Unlike a typical radiology workstation, 3D Slicer is free and is not tied to specific hardware. As a programming platform, 3D Slicer facilitates translation and evaluation of the new quantitative methods by allowing the biomedical researcher to focus on the implementation of the algorithm and providing abstractions for the common tasks of data communication, visualization and user interface development. Compared to other tools that provide aspects of this functionality, 3D Slicer is fully open source and can be readily extended and redistributed. In addition, 3D Slicer is designed to facilitate the development of new functionality in the form of 3D Slicer extensions. In this paper, we present an overview of 3D Slicer as a platform for prototyping, development and evaluation of image analysis tools for clinical research applications. To illustrate the utility of the platform in the scope of QIN, we discuss several use cases of 3D Slicer by the existing QIN teams, and we elaborate on the future directions that can further facilitate development and validation of imaging biomarkers using 3D Slicer.Copyright © 2012 Elsevier Inc. All rights reserved.
Pancreas segmentation based on dual-decoder U-Net convolutional neural network
[J].
基于双解码U型卷积神经网络的胰腺分割
[J].
Large-scale multi-center CT and MRI segmentation of pancreas with deep learning
[J].DOI:10.1016/j.media.2024.103382 URL [本文引用: 2]
Transformer guided progressive fusion network for 3D pancreas and pancreatic mass segmentation
[J].DOI:10.1016/j.media.2023.102801 URL [本文引用: 1]
MAFE-Net: A multi-level attention feature extraction network for pancreas segmentation
[J].
Fat distribution within the pancreas according to diabetes status and insulin traits
[J].
DOI:10.2337/db21-0976
URL
[本文引用: 1]
A growing body of evidence suggests that intrapancreatic fat is associated with diabetes, but whether distribution of intrapancreatic fat across the regions of the pancreas has a pathophysiologic role is unknown. The aim of this study was to investigate the differences in intrapancreatic fat deposition between the head, body, and tail of the pancreas, as well as the relationship between regional intrapancreatic fat deposition and diabetes status and insulin traits. A total of 368 adults from the general population underwent MRI on a 3 Tesla scanner, and intrapancreatic fat was manually quantified in duplicate. Statistical models included adjustment for age, sex, ethnicity, BMI, and liver fat. Intrapancreatic fat deposition in the head, body, and tail of the pancreas did not differ significantly in adjusted models in either the overall cohort or the three subgroups based on diabetes status. HOMA of insulin resistance and fasting insulin were significantly positively associated with fat in the tail and body of the pancreas. There was no significant association between regional intrapancreatic fat and HOMA of β-cell function. The association of increased intrapancreatic fat deposition in the tail and body regions with increased insulin resistance may have an important role in the early identification of patients at risk for developing insulin resistance and diseases that stem from it.
